
ZoomCharts line of advanced data visualization software lets you take ordinary data and turn it into an exciting way to dive deeper into vast amounts of information. Present data in fully interactive charts that work on all modern devices, including touch screen devices, work with massive data sets, and do it all at incredibly fast speeds and unmatched performance with ZoomCharts. As the world’s leading interactive data visualization software, ZoomCharts offers the most efficient tools to let you organize and tweak data presentation with seamless transitions.
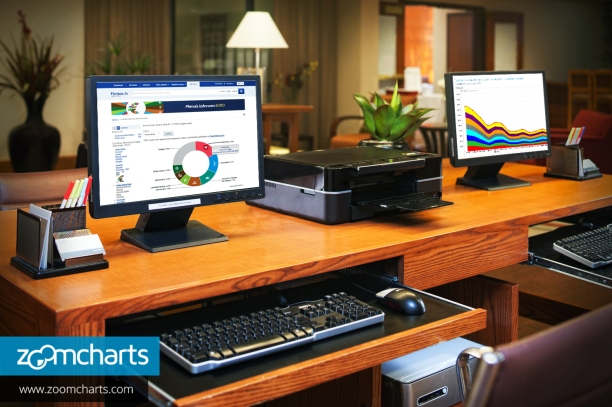
ZoomCharts pie charts are ideal for presenting big data in a simple manner. You present only the information you want to see, and drill down further to expand on information and go deeper with a simple click. This is why Latvian website Firmas chose ZoomCharts to explore and present industry statistics with a pie chart.
Firmas produces the Latvian Business Annual Report, which explores business statistics. Firmas used a ZoomCharts pie chart to present Latvian business net turnover share for 2013, which included industries such as forest, production, agriculture, construction, retail, energy, transport, logistics and transportation, real estate, IT and computers, tourism, hospitality and entertainment, services, telecommunications, media, advertising, education and creative industries, medicine and pharmacy, food and beverage, and financial, legal, and business services.
With ZoomCharts’ interactive pie charts, a variety of options are available to let users fully customize their viewing experience:
1. Hover over data to display detailed information.
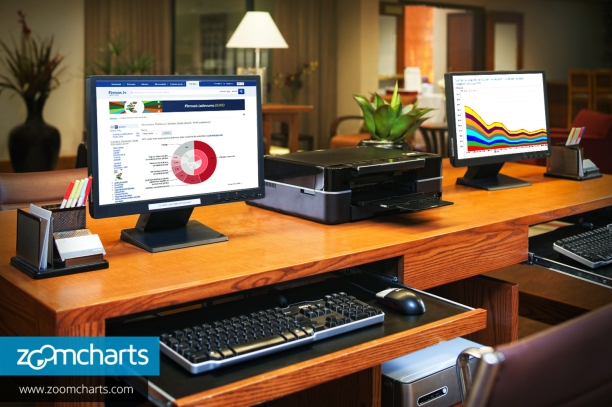
2. Click on a data set to expand information.

3. Click on data sets to drill down even further.
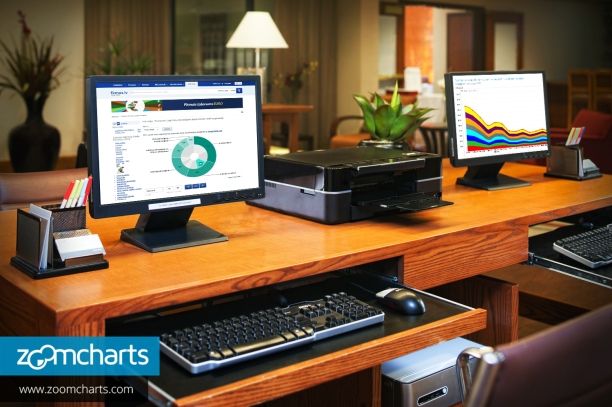
4. Click in the middle of the chart to go back to previous data.

5. Export data to view chart in other formats.
Check out ZoomCharts products:
Network Chart
Big network exploration
Explore linked data sets. Highlight relevant data with dynamic filters and visual styles. Incremental data loading. Exploration with focus nodes.
Time Chart
Time navigation and exploration tool
Browse activity logs, select time ranges. Multiple data series and value axes. Switch between time units.
Pie Chart
Amazingly intuitive hierarchical data exploration
Get quick overview of your data and drill down when necessary. All in a single easy to use chart.
Facet Chart
Scrollable bar chart with drill-down
Compare values side by side and provide easy access to the long tail.
ZoomCharts
http://www.zoomcharts.com
The world’s most interactive data visualization software
